For GTM teams, this makes revenue explainable under scrutiny. Context graphs do not replace CRMs or BI tools. They add an explanatory layer that helps teams understand why metrics move, defend forecasts and reviews, and build structured decision trails that both humans and AI systems can reason about over time.
In one sentence: a context graph connects GTM outcomes to the people, events, definitions, and signals that produced them, so teams can explain why performance changed, not just report what changed.
What is a context graph?
A context graph is a structured way to represent GTM data that preserves not only entities (accounts, opportunities, activities, and people) and the relationships between them, but also the context that gives those relationships meaning.
Unlike traditional databases that store facts, or CRMs that store current operational state, context graphs preserve how, when, and under what conditions decisions were made and outcomes occurred. Revenue is treated not as a static number tied to a deal, but as the result of a sequence of actions and signals that can be traced and explained.
This distinction matters most when numbers must be defended rather than merely reported, such as in WBRs, forecasting calls, or board discussions. Dashboards can show what changed, and CRMs can enumerate the records involved, but the reasoning behind those changes is rarely carried forward with the numbers themselves. As data is aggregated or recalculated, context becomes fragmented across notes, tickets, and conversations, making it difficult to retrieve and reason about under scrutiny.
Context graphs address this gap by preserving GTM activity as a sequenced decision trail. Over time, these trails form precedents that show how similar situations unfolded, which signals mattered, and which ones turned out to be noise. This is also what makes context graphs increasingly relevant as AI enters GTM workflows: they provide the structured context needed to explain outcomes and support better judgment.
How context graphs work in a GTM environment
In a GTM environment, context is derived from signals across the stack, including:
- CRM data (accounts, opportunities, stage changes, ownership)
- Revenue and billing events (invoices, expansions, renewals, delays)
- Sales and CS activities (meetings, emails, call recordings)
- Customer communications (Slack threads, email exchanges)
- Support signals (tickets, escalations, product usage limits)
- Product and usage data (feature adoption, activation events)
- Definitions and policies (forecasting rules, lifecycle stages, approval thresholds)
- Internal Documents (WBRs, post-mortems)
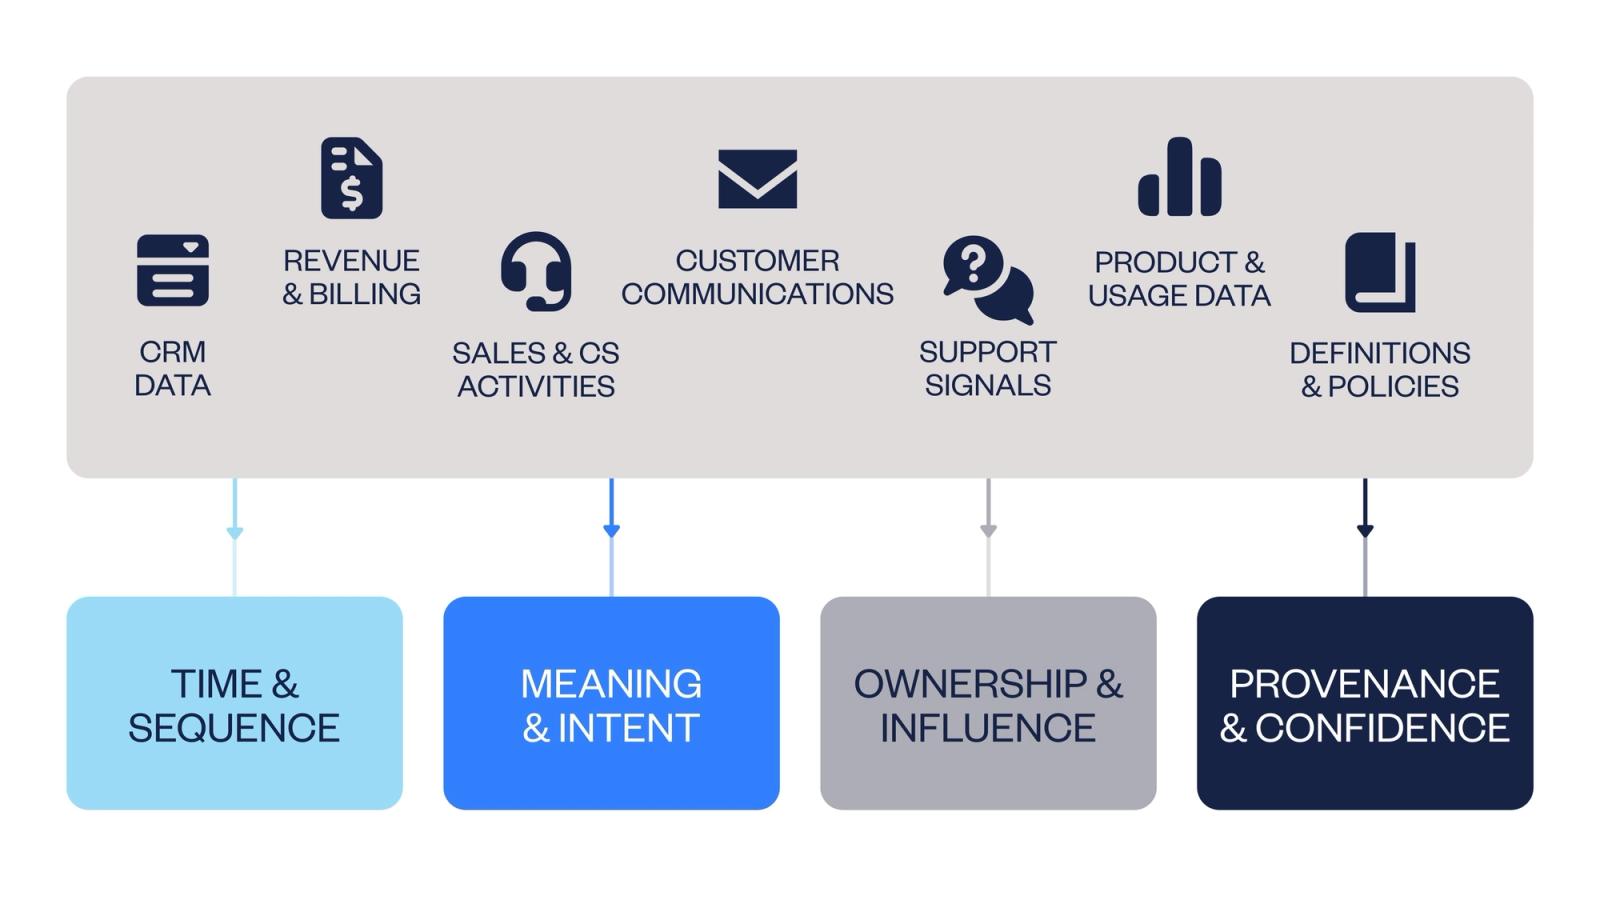
A context graph organizes these signals across four critical dimensions:
Time and sequence.
Context graphs preserve the order in which things happened: when a deal entered a stage, when activity dropped, when ownership changed, or when a forecast was updated. Sequencing helps distinguish cause from coincidence.
Meaning and intent.
Not all signals carry the same weight. Context graphs capture what an event represents in the GTM process, such as a qualification step, a risk signal, a handoff, or a commitment.
Ownership and influence.
Revenue is shaped by people as much as by process. Context graphs track who acted on what and when, making it possible to understand how changes in ownership, coverage, or capacity influenced outcomes.
Provenance and confidence.
GTM data comes from multiple systems with different levels of reliability. Context graphs preserve where a signal originated and how much confidence it should carry, allowing teams to weigh recurring patterns differently from isolated anomalies.
Together, these dimensions turn fragmented GTM data into a connected decision trail.
A concrete example: what a context graph changes in practice
Consider a common question: “Why did pipeline drop 18% in EMEA this month?”
A dashboard can show the drop. A CRM can list impacted opportunities. But the real answer usually requires stitching together multiple signals across systems and time.
With a context graph, teams can trace the decision trail:
- Ownership change: two enterprise reps moved territories, creating a temporary coverage gap
- Sequence shift: activity dropped 12 days before stage conversion declined
- Segment composition: SMB pipeline remained flat, while enterprise pipeline fell by 31%
- Support context: escalations increased in the top 10 accounts, pulling CS capacity into firefighting
- Forecast exception: a VP-level override excluded 3 deals due to procurement delays
- Confidence: high, based on consistent signals and a repeated pattern observed in past quarters
Instead of concluding that “pipeline dropped,” the narrative becomes: enterprise coverage shifted, activity fell, conversion followed, and forecast definitions excluded delayed deals. This was not a broad demand collapse, but a sequence of operational and definitional factors that interacted over time.
That’s the difference between reporting and explanation.
CRM, BI, and context graphs: different roles
CRMs, BI tools, and context graphs serve different purposes for GTM teams.
CRMs are systems of record. They capture the current operational state of the business and are optimized for execution and coordination. When information is updated or overwritten, much of the decision context that led to that state is lost.
BI tools are systems of reporting. They aggregate data across sources to show what happened and how performance changed over time. While dashboards are effective for monitoring trends, aggregation flattens sequences and relationships, which limits explanation.
Context graphs act as systems of explanation. They preserve how GTM signals relate to each other over time, making it possible to connect metrics back to the actions, conditions, and decisions that produced them.
These tools are complementary. CRMs support execution. BI tools support visibility. Context graphs support reasoning.
Where does a context graph fit in the GTM tech stack?
From a technical standpoint, a context graph is not a single tool or product. It can exist as a logical structure rather than a visible system, modeled in a data warehouse, implemented in an internal application, or supported by an external platform.
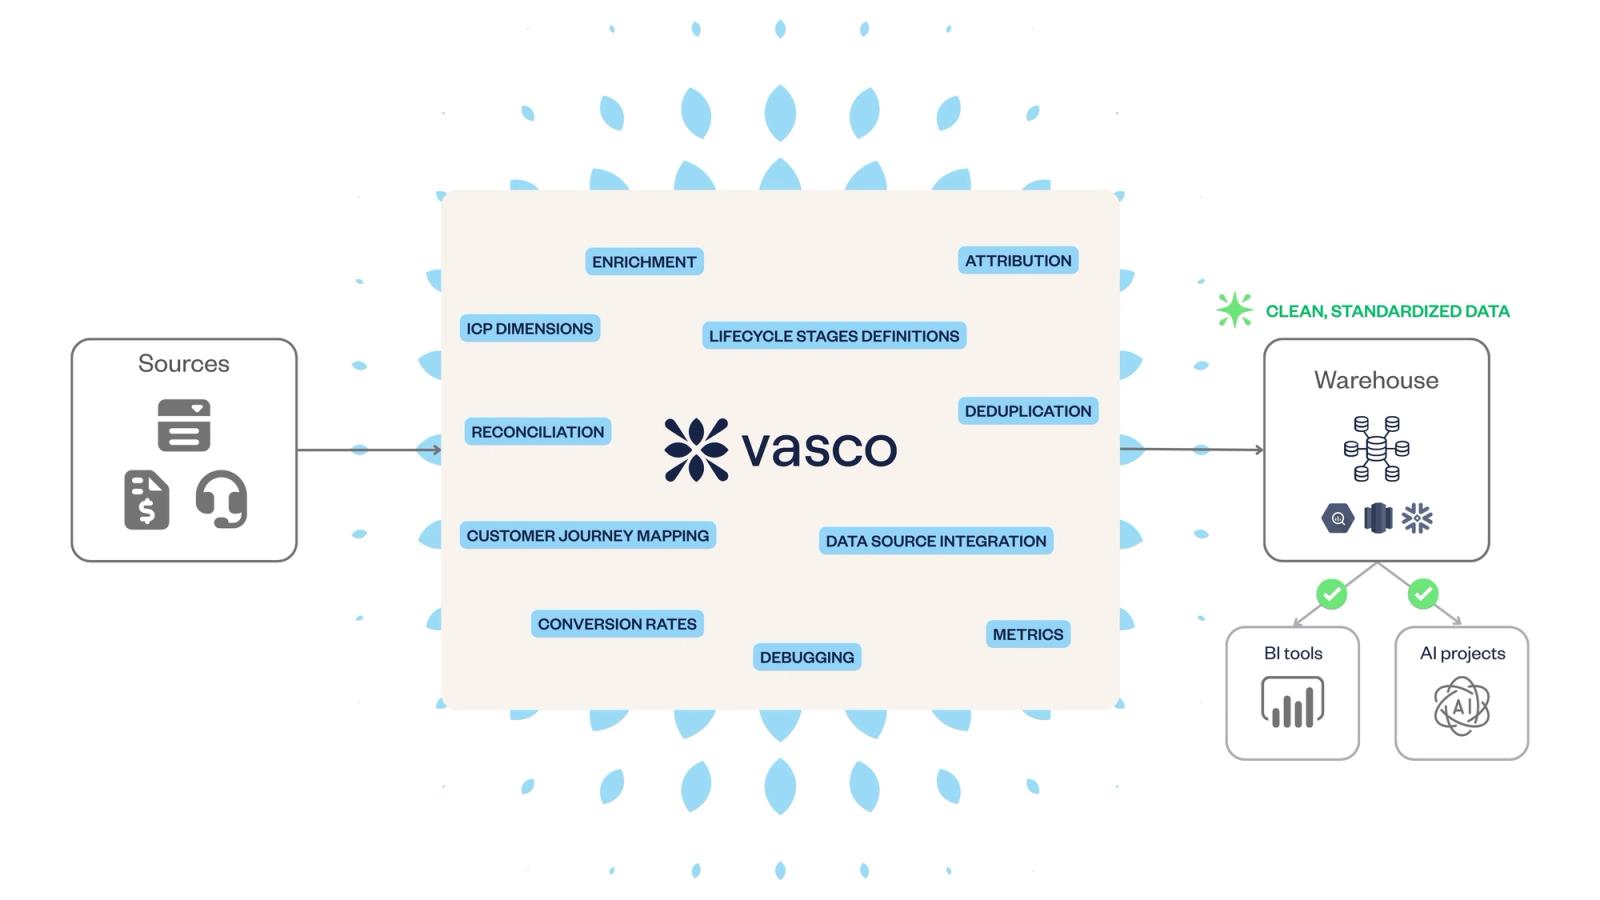
In practice, this often starts with aggregating GTM data from systems such as CRM, billing, product usage, support, or call recordings, and preserving the relationships and timing between signals.
Some platforms, including tools like Vasco, operate in this layer by unifying GTM data and making revenue signals easier to analyze and explain, without requiring teams to manage an explicit graph themselves.
Are context graphs realistic for seed to Series B companies?
Yes. Context graphs are realistic for Seed to Series B companies when approached as an evolving capability rather than a large, upfront infrastructure project.
Early-stage teams benefit from establishing their revenue engine early, but they do not need a custom, engineer-heavy system to take a first step toward a context graph. The initial value comes from structuring GTM data and decisions consistently, not from building a dedicated graph architecture from day one.
In practice, this starts with foundational work teams should do early, such as defining lifecycle stages, aligning on core GTM concepts such as the bowtie model, and connecting signals across systems like CRM, billing, product usage, or customer interactions. Platforms like Vasco operate at this level by unifying GTM data and preserving relationships between signals, creating a foundation for contextual reasoning without added complexity.
This is where starting early matters. As forecasts, Weekly Business Reviews, and post-mortems are reviewed through a shared structure, context compounds. Each decision becomes a precedent, making future reasoning faster and more reliable.
Seen this way, context graphs are less about technical maturity and more about operational discipline.
From explanation to AI support
Context graphs do not automate decisions on their own. Their primary value is explanatory: making it possible to trace how GTM outcomes emerged from a sequence of signals and actions.
As similar situations repeat, context graphs accumulate structured precedents. This gives AI systems a grounded way to recognize familiar situations as they unfold.
Using this context, AI agents can:
- surface likely drivers behind performance changes
- identify which signals historically mattered most in similar situations
- suggest responses that previously led to better outcomes
- flag early patterns that, in past episodes, preceded risk or opportunity
Because these suggestions are anchored in inspectable decision trails and prior context, they are easier to evaluate, challenge, and trust. Over time, well-understood and low-risk decisions can move from recommendation to partial or conditional automation.
For GTM teams, the real leverage is not fully autonomous decision-making, but AI that reduces repetitive analysis, surfaces relevant precedents, and supports faster, higher-quality decisions — while keeping humans in the loop where judgment matters most.
Key takeaways
- Context graphs explain why GTM metrics move, not just what happened
- They add an explanatory layer on top of CRM and BI tools
- Time, meaning, ownership, and provenance are critical to GTM reasoning
- Context graphs can start narrow and compound value over time
- They create the foundation for explainable, trustworthy AI in GTM