1. Pulse, your new command center
Diagnose your entire revenue engine in one unified view, powered by real-time data.
- Track beginning, net new, and ending ARR in a single snapshot, with clear plan vs actual deltas to ground every discussion in real performance.
- Analyze the full funnel from pre-awareness to expansion, switching seamlessly by stage or function to understand how marketing, sales, and customer success contribute to revenue.
- Focus on what truly drives (or leaks) revenue with Impact panels highlighting top drivers, conversion and time metrics, ICP efficiency, and instant drilldowns to the underlying data.
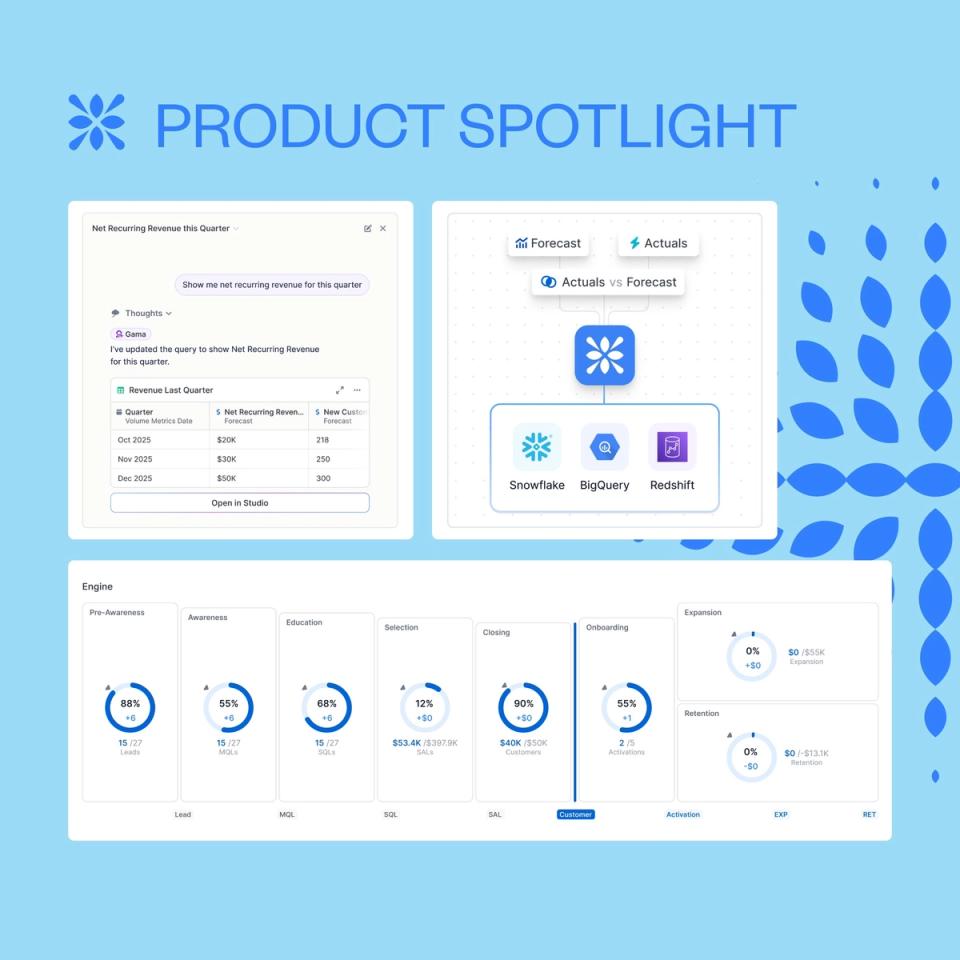
2. Studio: explore and explain your revenue data
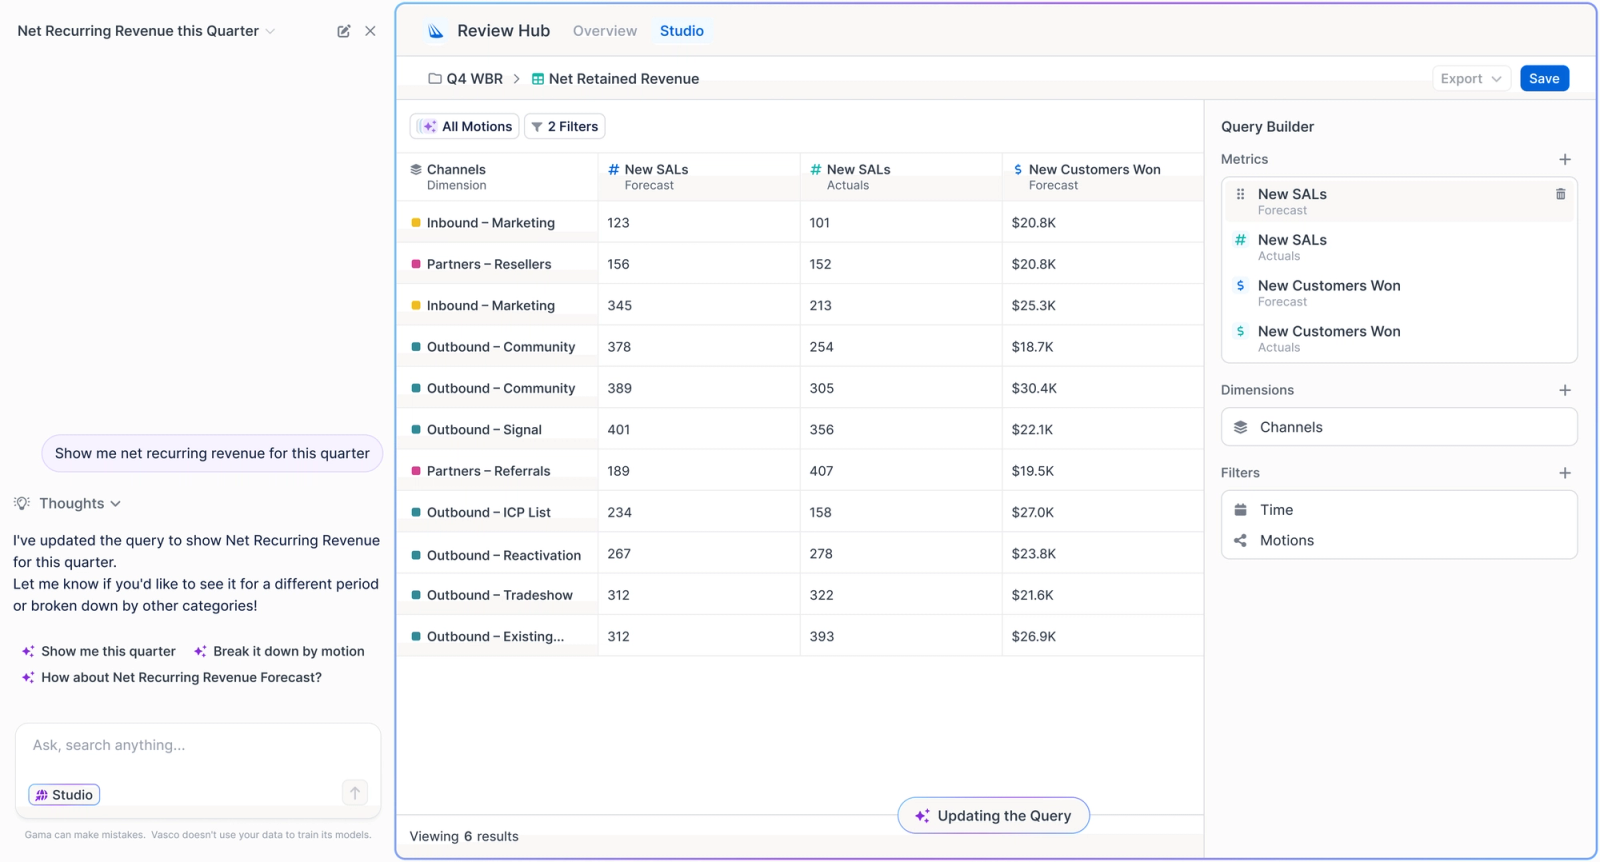
Studio is Vasco’s analysis workspace. It lets you explore revenue data, break down KPIs, and drill into results to understand what happened and why — without writing SQL.
- Analyze KPIs using custom dimensions and time-based metrics
- Drill into any number to see the accounts, motions, or drivers behind it
- Sort, aggregate, and explore data in a spreadsheet-like experience, built for RevOps questions
3. Plan vs actuals, from Vasco to your warehouse
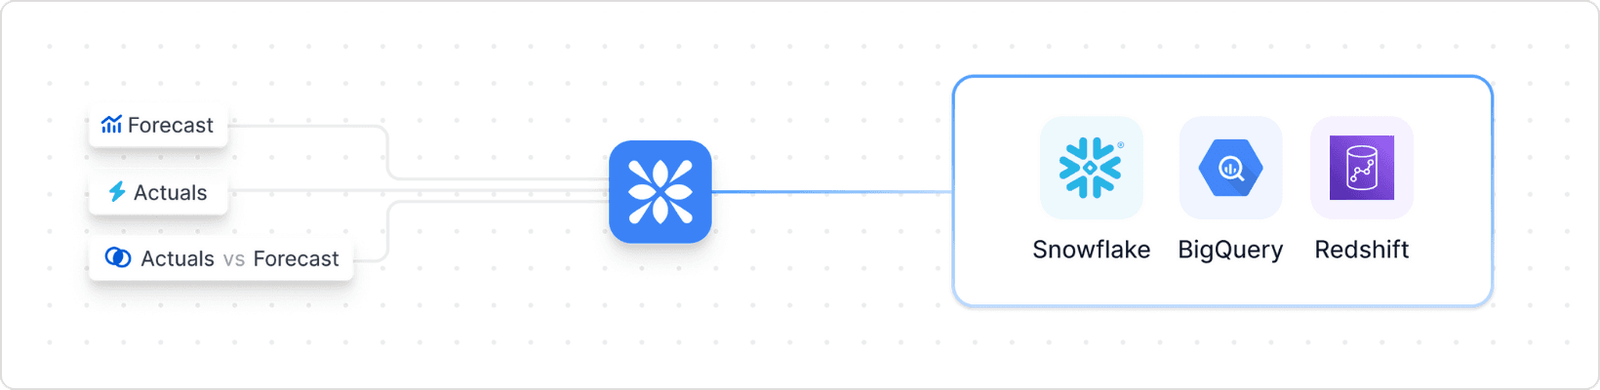
Destinations let you send your revenue data to your data warehouse or BI. Until now, this data included actuals only. Forecasts are now included, so you can analyze plan vs actuals in one place.
- Export actuals and forecasts together, using a consistent schema
- Compare plan vs actuals by function, motion, channel, position, or employee
- Remove manual reconciliation and build end-to-end planning analytics downstream
Other cool upgrades
- Clearer hub navigation, making it easier to move between Planning, Execution, and Review
- Stage diagnostics consolidated into Pulse, reducing navigation friction and duplicate views
- Faster data updates across the platform, so insights stay fresh and responsive